Introduction
After hitting an almost seven year low of $US0.6827 in January the Australian dollar has rebounded by 12% or so hitting a high of $US0.7680. The rebound begs the question as to what is driving it and more fundamentally whether the 38% decline from its 2011 high against the US dollar has now run its course. This note looks at the main issues and what it means for investors.
Why the rebound?
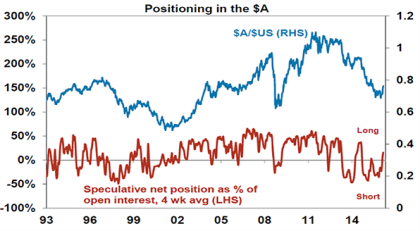
A classic aspect of investing is to be wary of the crowd. When investor sentiment and positioning in an asset reaches extremes it often takes only a slight change in the news to drive a big reversal in the asset’s price. And so it is with the Australian dollar. After its large fall to below $US0.70 big speculative short (or underweight) positions had built up. This coincided with a lot of talk about a “big short” in Australian property, banks and the $A. This can be seen in the next chart.

Source: Bloomberg, AMP Capital
And then over the last month or so the news for the Australian dollar has turned more positive with commodity prices bouncing back (from their recent lows oil is up 50%, copper is up 15% and iron ore is up 45%), the Fed sounding more dovish and delaying rate hikes which has pushed the $US down generally and Australian economic growth holding up well. The combination of a more dovish Fed and better Australian data has seen a widening in expected interest rate differentials between Australia and the US, which makes it relatively more attractive to park money in Australia. So with more positive news on Australian export earnings and the relative interest rate in favour of Australia, speculators and traders have closed their short positions and the Australian dollar has rebounded.
More broadly the rebound in the $A has been part of a return to favour by growth assets since January/February that has seen shares, commodities, corporate debt and growth sensitive currencies rebound as worries about a global recession receded. This is often referred to as “risk on”.
Will the rebound in the $A be sustained?
In the very short term the $A could still go higher yet as long positions in it are still not extreme and the Fed’s new found dovishness could linger. A rise to $US0.80 is possible. However, it’s premature to say that the $A has seen its lows and the trend is now up. In fact my view remains that the trend is still down. First, just as the long term upswing in the value of the $A from $US0.48 in 2001 saw multiple setbacks, including a 39% plunge in 2008, on its way to the 2011 high of $US1.10 the secular down trend that started in 2011 is likely to have several reversals too. There will always be short term/cyclical swings.
Second, the recent rally looks a bit like the 9% short covering rally that occurred in early 2014. After falling through parity in 2013 the $A hit a low of $US0.8660 in January 2014 by which time large short positions had been built up. These were then closed as the RBA saw it prudent to opt for an extended “period of stability” in interest rates and commodity prices bounced higher which pushed the $A up and left it stuck around $US0.94 for five months. Once short positions had reversed, commodity prices resumed their downswing and it looked like the RBA would have to cut rates again the $A resumed its downswing.
Third, fundamental drivers still point south for the $A:
-
Commodity prices – while the worst is probably behind us, commodity prices likely remain in a long term, or secular downswing thanks to a surge in supply after record investment in resources for everything from coal and iron ore to gas and slower global demand growth. As can be seen in the next chart raw material prices trace out roughly 10 year long term upswings followed by 10 to 20 year long term bear markets. This long term cycle largely reflects the long lags in supply adjustments.

Source: Global Financial Data, Bloomberg, AMP Capital
Plunging prices for commodities have resulted in a collapse in Australian export prices and hence our terms of trade and this weighs on the value of the $A. This is highlighted by the iron ore price which at the start of last decade was below $US20/tonne rising to over $US180/tonne in 2011 and is now running around $US55/tonne.
-
Interest rates – the interest rate differential in favour of Australia is likely to continue to narrow, making it relatively less attractive to park money in Australia as part of the so-called “carry trade”. While Fed hikes have paused recently in response to global growth worries, they are likely to resume at some point this year in line with the so-called “dot plot” of Fed officials interest rate expectations pointing to two 0.25% hikes this year.
Meanwhile, although it’s a close call we remain of the view that the RBA will cut interest rates again in the months ahead: as mining investment continues to unwind; the contribution to growth from the housing sector via building activity and wealth effects starts to slow over the year ahead making it critical that $A sensitive sectors like tourism and education are able to fill the gap; to offset possible further out of cycle bank interest rate hikes; and as inflation remains at the low end of the target range. The strengthening $A also adds to the case for another rate cut.
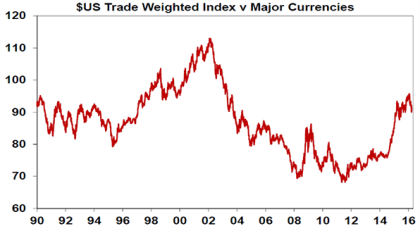
A final critical driver of the Australian dollar is the US dollar itself – but it has become more ambiguous. The ascent of the US dollar from 2011 was a strong additional drag on the $A both directly and via its impact on commodity prices. However, it also added to concerns about the emerging world (as a rising $US makes it harder to service US dollar denominated loans raising the risk of some sort of financial crisis) and as a rising $US constrains US economic growth, doing part of the Fed’s job for it. Consequently, the sharp upwards pressure on the value of the $US may have run its course. But with the Fed still gradually tightening a sharp fall in the $US is unlikely either. Rather it’s likely to track sideways.

Source: Bloomberg, AMP Capital
$A likely to resume its downswing
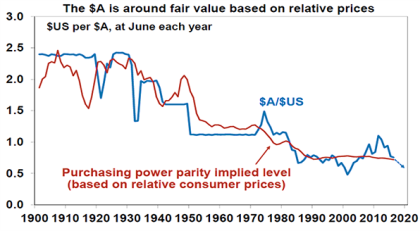
So while the big picture outlook for the $US has turned neutral, the combination of soft commodity prices and the relative interest rate differential between Australia and the US set to narrow point to a resumption of the downtrend in the $A in the months ahead. How far it may fall is impossible to tell. One guide is via what is called purchasing power parity (PPP), according to which exchange rates should equilibrate the price of a basket of goods and services across countries. The next chart shows the $A/$US rate against where it would be if the rate had moved to equilibrate relative consumer price levels between the US and Australia since 1900.

Source: RBA, ABS, AMP Capital
Right now the $A is around fair value on this measure of $US0.75. But it can be seen from the chart that the $A rarely stays at the purchasing power parity level for long and is pushed to extremes above and below. Right now the commodity down cycle is likely to push the $A to overshoot fair value on the downside. In a way this could be seen as making up for the damage done to the economy during the period above parity. This is likely to take the $A towards $US0.60 on a 12 month horizon.
Implications for investors
There are a several implications for investors. First, the likely resumption of the downtrend in the $A highlights the case for Australian based investors to maintain a decent exposure to offshore assets that are not hedged back to Australian dollars (ie remain exposed to foreign currencies). Put simply, a declining $A boosts the value of an investment in offshore assets denominated in foreign currency one for one. This has been seen over the past five years to February where the fall in the value of the $A turned a 7.1% pa return from global shares measured in local currencies into a 12.9% pa return for Australian investors when measured in Australian dollars.
Second, having an exposure to foreign currency provides a useful hedge for Australian based investors in case we are wrong and the global growth outlook deteriorates significantly. The $A invariably falls (and foreign currencies rise) in response to weaker global growth.
Finally, the fall in the value of the $A to levels that offset or more than offset Australia’s relatively high cost levels is very positive for sectors that compete internationally including manufacturing, tourism, higher education, agriculture & miners. This in turn should continue to help the economy weather the mining downturn and is in turn positive for the Australian share market. Roughly speaking each 10% fall in the value of the $A boosts company earnings by 3%.
Source: AMP Capital
About the Author
Dr Shane Oliver, Head of Investment Strategy and Economics and Chief Economist at AMP Capital is responsible for AMP Capital’s diversified investment funds. He also provides economic forecasts and analysis of key variables and issues affecting, or likely to affect, all asset markets.
Important note: While every care has been taken in the preparation of this article, AMP Capital Investors Limited (ABN 59 001 777 591, AFSL 232497) and AMP Capital Funds Management Limited (ABN 15 159 557 721, AFSL 426455) makes no representations or warranties as to the accuracy or completeness of any statement in it including, without limitation, any forecasts. Past performance is not a reliable indicator of future performance. This article has been prepared for the purpose of providing general information, without taking account of any particular investor’s objectives, financial situation or needs. An investor should, before making any investment decisions, consider the appropriateness of the information in this article, and seek professional advice, having regard to the investor’s objectives, financial situation and needs. This article is solely for the use of the party to whom it is provided.


