
This month of October often creates apprehension amongst investors given its historic track record with the 1929 and 1987 share market crashes. And it was in October 2007 that US shares peaked ahead of 50% plus falls (in most share markets) through the Global Financial Crisis (GFC). From the post-GFC share market lows in March 2009, US shares are up 278% and global shares are up 196% to new record highs and Australian shares are up 92%. After such strong gains it’s natural to wonder whether another major bear market is imminent. Aside from left field events triggering a crash, the key question remains where are we in the investment cycle? This note updates our analysis on this front from earlier this year (see http://bit.ly/2kPIlha) and also provides a comparison to 1987.
Second-longest US cyclical bull market since WW2
The cyclical bull market in US shares is eight and a half years old. It’s the second longest since World War Two and the second strongest in terms of gain. See the next table.
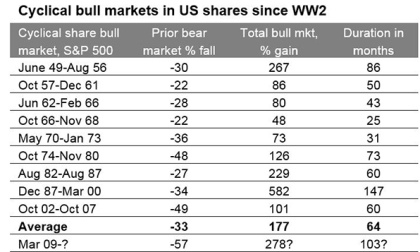
I have applied the definition that a cyclical bull market is a rising trend in shares that ends when shares have a 20% or more fall (ie, a cyclical bear market). Source: Bloomberg, AMP Capital.
At the same time, according to the US National Bureau of Economic Research the current US economic expansion is now 100 months old and compares to an average expansion of 70 months. The concern is that with the US bull market and economic expansion both old, US shares are vulnerable to another bear market and, by implication, global and Australian shares are, too.
Still in the sweet spot in the investment cycle
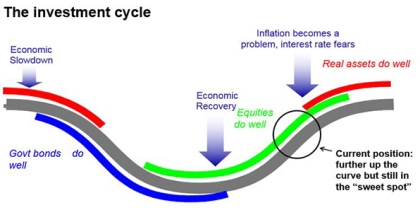
First some context. The next chart is a stylised version of the investment cycle – the thick grey line is the economic cycle.
Source: AMP Capital
A typical cyclical bull market in shares has three phases: scepticism – when economic conditions are weak and confidence is poor, but smart investors see value in shares helped by ultra easy monetary conditions; optimism or the “sweet spot” – when profits and growth strengthen and investor scepticism gives way to optimism while monetary policy is still easy; euphoria – when investors become euphoric on strong economic and profit conditions, which pushes shares into clear overvalued territory and excesses appear forcing central banks to become tight, which combines with overvaluation and investors being fully invested to drive a new bear market.
Typically, the bull phase lasts five years. However, “bull markets do not die of old age but of exhaustion” – their length depends on how quickly recovery precedes, excess builds up, inflation rises and extremes of overvaluation and investor euphoria appear.
Our assessment is that we are still in the “sweet spot” phase, albeit more advanced now. Global economic indicators are strong, growth forecasts are being revised up as highlighted by the IMF and this is driving stronger profits. But thanks partly to the slow post GFC recovery, there are still few signs of the sort of excesses that characterise the “euphoria” phase that ultimately leads to the “exhaustion” of the cyclical bull market and the next bear market.
-
There is no overinvestment globally. While the US recovery is further advanced than most, even here business investment and housing investment (excesses in which preceded the tech wreck and GFC, respectively) are around or below long-term averages relative to GDP.
-
Overall private sector debt growth is modest in most countries.
-
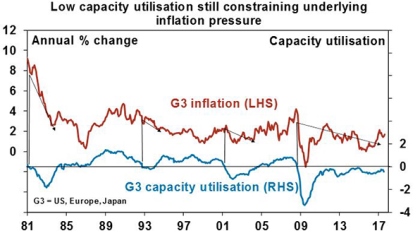
After years of below trend growth globally, spare capacity still remains & this (along with technological innovation) has been constraining inflation. Wages growth remains weak and has only just started picking up in the US. Core inflation in major countries ranges between 0.2% in Japan to 1.3% in the US.
Source: Bloomberg, AMP Capital
-
As a result, global monetary conditions remain easy and without a surge in inflation look likely to remain so. The Fed is continuing to tighten but it’s “gradual” and from a very easy base and other central banks (including the RBA) are on hold. A shift to tight money that brings about a global economic downturn looks a fair way off.
-
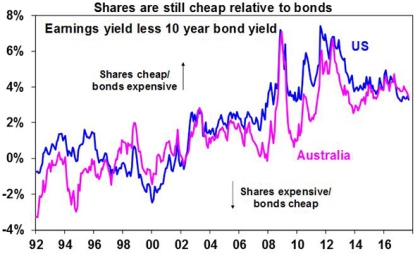
Share market valuations are mostly okay. Measured against their own history, shares are no longer cheap. This is particularly so for US shares. But once allowance is made for low inflation and still-low bond yields, shares are fair value to cheap depending on the market (next chart).
Source: Bloomberg, AMP Capital
-
Finally, while short term investor sentiment bullish, long-term measures of positioning are not. In the US, the huge investor flows into bond funds over the last few years have yet to reverse in favour of shares. In Australia, sentiment towards shares remains low. Still no euphoria here.
It may also be argued that major non-US share markets and Australian shares did have a bear market in both 2011 and 2015-16 so their cyclical bull markets are not old at all.
Overall, we are still not seeing the signs of excess, euphoria and exhaustion that typically come at cyclical economic and share market peaks ahead of recessions and deep bear markets. So barring some sort of external shock, the cyclical bull market in shares looks like it still has further to go.
What to watch?
The key to watch for the next big bear market is for signs of excess – eg, overinvestment in key areas, rapidly-rising inflation, aggressive tightening in monetary policy, clear overvaluation and investor euphoria. This would then set the scene for the next economic downswing and hence a more severe bear market (as opposed to a correction or short-term bear market like we saw in 2015-16). At the moment, it’s hard to see much excess but we do expect US inflation to start rising from here. One risk is that the longer things remain benign, the more investors will expect them to remain benign and this will result in excessive risk taking setting up the scene for a sharp fall in markets. But it’s only lately investors have started to get comfortable. So this may have further to go.
What about comparisons to 1987?
October 19 marks the 30th anniversary of the 1987 share market crash and as always comparisons are being wheeled out. While the bulk of the crash was concentrated in October 1987 (US shares fell 20% on October 19 and Australian shares fell 25% on October 20), US shares fell 34% over three months and Australian shares lost 50% over two months. The causes remain subject to debate – but the key appears to have been a 3% rise in US inflation, a 2% rise in US bond yields and Fed tightening hitting markets after a period of very strong gains. The following tables provide a brief comparison to today.
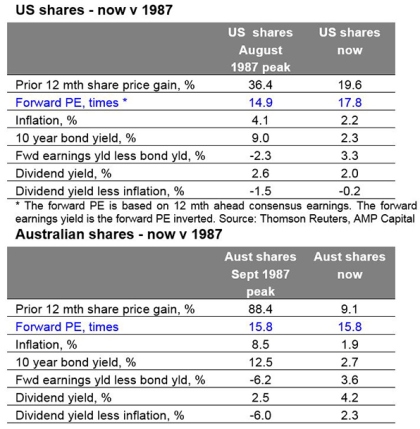
Source: Thomson Reuters, AMP Capital
Compared to 1987, the gains over the past 12 months have been more modest and while forward price to earnings ratios are higher (in the US) or the same, this should be the case given far lower inflation and bond yields and real dividend yields are far more attractive. It’s also noteworthy that share markets had already started to break down before the October 19 1987 crash whereas that has not happened now. As an aside, it’s worth noting that despite the 1987 crash, economic growth was barely impacted and so shares moved higher in 1988 and 1989.
Investment implications
First, corrections should be anticipated – with Trump, North Korea and the Fed being potential triggers – and the fickleness of investor confidence means we can’t rule out another crash like in 1987. But despite this we still appear to be a long way from the peak in the investment cycle.
Second, non-US share markets and economies are less advanced in their cycles and provide opportunities for investors.
Finally, it’s worth noting that several bad years (1987 and 1929) have given Octobers a bad wrap globally. While historically they have been a soft month in Australia (with shares down an average 0.3% since 1985 in October), they have actually been positive in the US (up 1% on average).
Source : AMP Capital 18th October 2017
About the Author
Dr Shane Oliver, Head of Investment Strategy and Economics and Chief Economist at AMP: l is responsible for AMP Capital’s diversified investment funds. He also provides economic forecasts and analysis of key variables and issues affecting, or likely to affect, all asset markets.
Important note: While every care has been taken in the preparation of this article, AMP Capital Investors Limited (ABN 59 001 777 591, AFSL 232497) and AMP Capital Funds Management Limited (ABN 15 159 557 721, AFSL 426455) makes no representations or warranties as to the accuracy or completeness of any statement in it including, without limitation, any forecasts. Past performance is not a reliable indicator of future performance. This article has been prepared for the purpose of providing general information, without taking account of any particular investor’s objectives, financial situation or needs. An investor should, before making any investment decisions, consider the appropriateness of the information in this article, and seek professional advice, having regard to the investor’s objectives, financial situation and needs. This article is solely for the use of the party to whom it is provided.


