Dr Shane Oliver – Head of Investment Strategy and Chief Economist, AMP Capital
Key points
-
Since its February high of around $US0.80 the $A the $A has fallen on the back of global growth concerns, a slowdown in China and the Delta outbreak in Australia.
-
However, there is good reason to expect the $A to resume its rising trend: sentiment towards the $A is negative; global growth is likely to remain strong; commodities look to have entered a new super cycle; Australia has a large current account surplus; and Australia is likely to see strong growth next year.
-
There is a case for Australian based investors to tilt a bit to hedged global investments but while maintaining a still decent exposure to foreign currency given the diversification benefits it provides.
Introduction
Movements in the value of the Australian dollar are important for Australian-based investors in that they directly impact the value of (and hence returns from) international investments and indirectly effect the performance of domestic assets like shares via the impact on Australia’s competitiveness. But currency movements are also one of the hardest things to get right. This year has been no exception with the $A initially surging to $US0.80 in February only to then fall to a recent low of $US0.71. This note takes a look at the outlook for the $A.
The $A is around long-term fair value
From a long-term perspective the $A is around fair value. The best guide to this is what is called purchasing power parity (PPP) according to which exchange rates should equilibrate the price of a basket of goods and services across countries – see the next chart that shows annual data for the $A back to 1900.
The $A is “around” fair value based on relative prices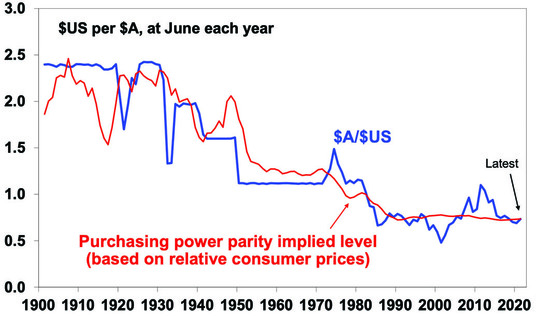
Source: RBA, ABS, AMP Capital
If over time Australian inflation and costs rise relative to the US, then the value of the $A should fall to maintain its real purchasing power. And vice versa if Australian inflation falls relative to the US. Consistent with this the $A tends to move in line with relative price differentials – or its purchasing power parity implied level – over the long-term. And right now, it’s around fair value. So, nothing to get excited about, right?
But as can be seen in the chart, it rarely spends much time at the purchasing power parity level. Cyclical swings in the $A are largely driven by swings in the prices of Australia’s key commodity exports and relative interest rates, such that a fall in Australian rates relative to US rates makes it more attractive to park money in the US and hence pushes the $A down. “Investor” sentiment and positioning also impacts – such that if the $A is over-loved with investors overweight in it then it becomes vulnerable to a fall and vice versa if it’s under-loved.
Why has the $A fallen since February?
-
First, there has been concern that global growth may have peaked not helped by the latest global coronavirus wave driven by the more contagious Delta variant, supply chain constraints and central banks moving to reduce stimulus. This weighs on the Australian dollar because it’s a “growth asset” which, because of Australia’s high commodity exposure, is harmed by fears of weaker global growth.
-
Second, there is likely no quick exit from the coronavirus pandemic, and this is also adding to uncertainty to the global growth outlook. The vaccines provide very good protection against serious illness, but only 60% to 80% protection against infection and their efficacy appears to decline over time requiring boost shots. All of which combined with the higher transmissibility of the Delta variant is making coronavirus hard to eradicate. To this must be added the low level of vaccination in less developed countries which risks the mutation of new more problematic variants. All of which risks ongoing waves of coronavirus outbreaks until global immunity is built up by exposure to it and vaccination – and this will take time.
-
Third, these concerns for Australia have been accentuated by the slowdown in Chinese economic growth, in particular Chinese moves to slow steel production (to limit carbon emissions) and the property sector which has seen the iron ore price fall more than 40% since July.
-
Fourth, and related to this, tensions between China and Australia that have resulted in restrictions on various Australian imports into China have arguably been keeping the Australian dollar lower than it otherwise would be.
-
Finally, the Delta coronavirus outbreak has interrupted the Australian economic recovery, seen the RBA extend bond buying albeit at the reduced rate of $4bn a week and has pushed back expectations for the first rate hike. This is at a time when Fed tapering is getting closer and there is debate about whether the first Fed rate hike might come next year.
But there are five positives likely to push the $A up
Against this there are a bunch of forces suggesting that what we have seen since February is most likely part of a correction.
-
Firstly, global sentiment towards the $A is now negative again and this is reflected in short or underweight positions being back near extreme levels. In other words, many of those who want to sell the $A have already done so and this leaves it vulnerable to a rally if there is any good news.
$A positioning is back to being very short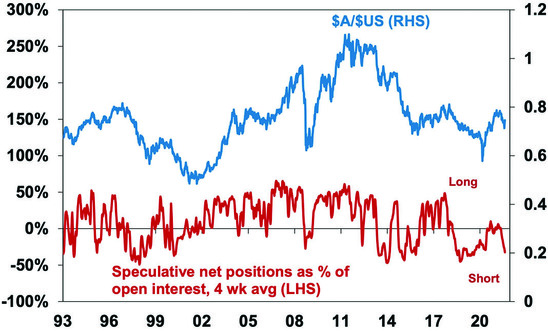
Source: Bloomberg, AMP Capital
-
Second, the global recovery is likely to remain strong even if we have seen the peak in growth. While it’s not a smooth ride, vaccines are helping keep hospitalisations and deaths down relative to past waves allowing heavily vaccinated countries in Europe, the UK and parts of the US to continue reopening and avoid a return to lockdowns. And policy easing in China is likely to see Chinese growth pick up next year. This is ultimately positive for the growth sensitive $A.
-
Third, commodity prices look to be embarking on a new super cycle. After bottoming in last year’s global lockdown metal prices and wider commodity indexes that include energy have surged to around the last mining boom highs of around 2011. The key drivers are a surge in goods demand, onshoring requiring new capex to avert a rerun of pandemic supply chain disruptions, the demand for clean energy and vehicles all compounded by global underinvestment in new commodity supply. For example, a battery electric vehicle contains 4 to 10 times as much copper as a conventional car. This has all seen Australia’s terms of trade rise to levels that last saw the $A above parity in 2011. Of course, the 40% and still falling collapse in the iron ore price will put a dent in this, but it’s partly offset by a surge in coal prices.
Long term bull and bear markets in commodity prices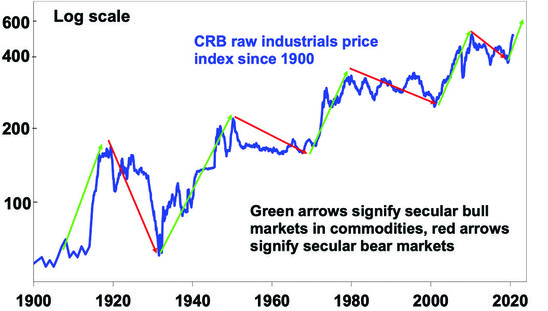
Source: Bloomberg, AMP Capital
-
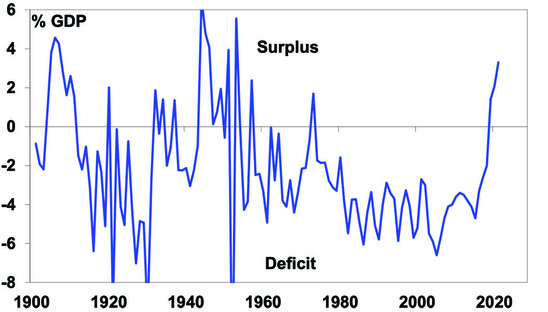
Fourth, Australia is seeing its biggest current account surpluses since the 1950s. A big part of this has been the surge into a trade surplus in the last four years – this will likely fall back somewhat due to the declining iron ore price but strength in other commodity prices will partly offset this. However, in recent years there has been a significant decline in Australia’s net income deficit as a result of super funds investing in international assets providing higher income yields than Australia pays on its foreign debt. The swing into a current account surplus means Australia is a capital exporter and that there is more natural transactional demand for the $A than supply.
Biggest Aust current account surpluses since 1950s
Source: ABS, AMP Capital
-
Finally, rapid vaccination is likely providing a path out lockdowns with Australia likely to see a return to growth next quarter and strong growth in 2022, which could neutralise the interest rate outlook between Australia and the US.
So where to from here?
Ultimately, we expect the positives notably in the form of strong global growth and high commodity prices to triumph over the negatives and push the Australian dollar higher, and over the next 12 months see it rising to around $US0.80-0.85.
What does it mean for investors?
A rise in the value of the Australian dollar will reduce the value of an international asset (and hence its return) by one for one, and vice versa for a fall in the $A. So last year global shares returned 13.8% in local currency terms but only 5.7% in Australian dollar terms as the $A rose in value. So, when investing in international assets an Australian investor has the choice of being hedged (which removes this currency impact) or unhedged (which leaves the investor exposed to $A changes). Given our expectation for the $A to rise over the next 12 months there is a case for investors to tilt towards a hedged exposure of their international investments.
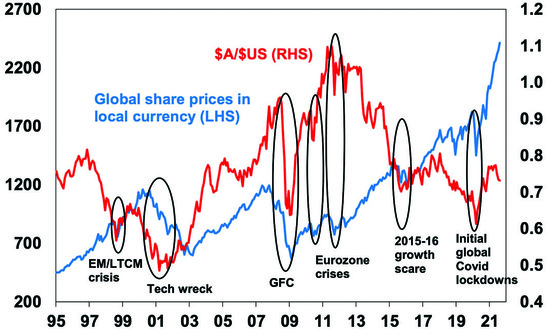
However, this should not be taken to an extreme for two key reasons. First, currency forecasting is hard to get right. Second, having foreign currency in an investor’s portfolio via unhedged foreign investments is a good diversifier if the economic and commodity outlook turns sour. As can be seen in the next chart there is a rough positive correlation between changes in global shares in their local currency terms and the $A. Major falls in global shares which are circled in the next chart saw sharp falls in the $A which offset the fall in global shares for Australian investors. So being short the $A and long foreign exchange provides good protection against threats to the global outlook.
Global share prices versus $A
Source: Bloomberg, AMP Capital
Finally, the last commodity super cycle in the 2000s saw Australian shares outperform global shares, so one way to play a new commodity super cycle would be via a higher exposure to Australian shares.
Source: AMP Capital September 2021
Important note: While every care has been taken in the preparation of this document, AMP Capital Investors Limited (ABN 59 001 777 591, AFSL 232497) and AMP Capital Funds Management Limited (ABN 15 159 557 721, AFSL 426455) make no representations or warranties as to the accuracy or completeness of any statement in it including, without limitation, any forecasts. Past performance is not a reliable indicator of future performance. This document has been prepared for the purpose of providing general information, without taking account of any particular investor’s objectives, financial situation or needs. An investor should, before making any investment decisions, consider the appropriateness of the information in this document, and seek professional advice, having regard to the investor’s objectives, financial situation and needs. This document is solely for the use of the party to whom it is provided.


