Australian shares lagging
Since the March 2009 Global Financial Crisis (GFC) low in share markets, Australian shares are up 65%, compared to a 145% gain in global shares in local currency terms and a 210% gain in US shares. In fact, both global and US shares reached record highs last year and still remain above pre GFC levels, whereas the Australian share market is around 24% below the record high of 6829 reached in November 2007.
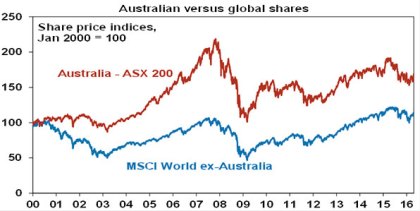
Source: Bloomberg, AMP Capital
So what gives? When might it turn around?
Why has the Australian share market underperformed?
The relatively poor performance of Australian shares since 2009 reflects a combination of factors:
-
Tighter monetary policy – whereas the US, Europe and Japan have had near zero interest rates and quantitative easing since the GFC, Australia has had much higher interest rates and no money printing. In fact, the relative underperformance really started in October 2009 when the RBA started to raise interest rates post GFC which was not followed by other major developed countries. While interest rates have since been cut they are still at 2% versus near zero in other developed countries.
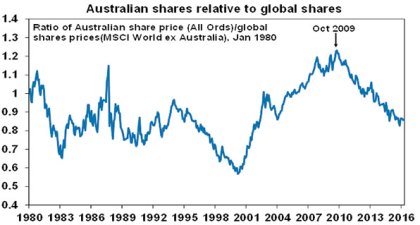
Source: Thomson Reuters, AMP Capital
-
The surge in the $A to $US1.10 in 2011 – this reduced the competitiveness of Australian companies; from which the damage can take a long time to reverse. By contrast, until a few years ago the US share market benefitted from the lagged effect of the big fall in the $US through last decade.
-
The slump in commodity prices – this has clearly weighed on resources shares. US, European and Japanese share markets have a lower exposure to resources shares.
-
Property crash phobia – foreign investor fear of a crash in Australia’s relatively expensive property market has been a constant theme for some time. Since 2010 the logic has been something like: “Australia’s massive property boom will crash following the end of the mining boom, crashing the banks and the economy”. Therefore many stayed away.
-
Mean reversion – the relative performance of Australian shares versus global shares has a long term tendency to mean reversion, whereby periods of outperformance are followed by periods of underperformance & vice versa. See the next chart. In short, the strong performance of Australian shares last decade set it up for underperformance this decade. The 2007 high was a much higher high than seen in other major share markets. So it was much easier for global shares to make a new high post the GFC.
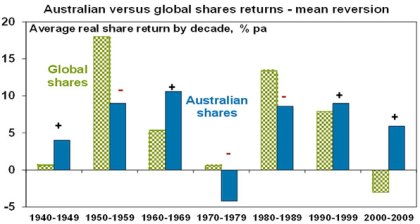
Source: ABN-Amro Global Investment Returns Yearbook, AMP Capital
Last decade was the time for commodities, emerging markets, Australian shares and commodity currencies, as opposed to traditional global shares dominated by the US, Europe and Japan and the US dollar. This de cade has been the opposite.
Are high dividend payouts to blame?
A common view is that Australian companies are not investing because shareholders are demanding high dividends and this could be causing poor earnings growth and poor share market returns. This is unlikely. The dividend payout ratio (ie dividends relative to earnings) is not significantly out of line with its historic norm. For industrials the payout ratio at around 75% is not significantly above where it was prior to the GFC. It’s mainly resources stocks that boosted payouts to above 100% from around 30% prior to the GFC. It’s hard to argue they should ramp up investment after having over-invested! In any case this is now being reversed as BHP and Rio cut their dividends.
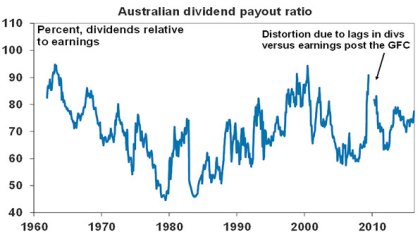
Source: Bloomberg, Global Financial Data, RBA, AMP Capital
The real reasons for the lack of investment by non-mining companies are likely to be: post-GFC caution, wariness after getting smashed through the mining boom by the high $A, high interest rates and high labour costs, and too high hurdle rates.
More fundamentally, Australia’s high dividend payouts are healthy from a long term perspective. There is evidence that high payouts actually drive higher (not lower) earnings growth and hence higher returns. There are several reasons this is the case: high dividend payouts mean less risk of poor investment decisions from retained earnings, they are indicative of corporate confidence about future earnings, and they indicate earnings are real and not an accounting fiction.
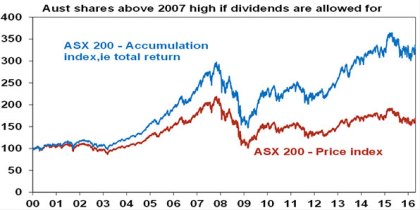
Not so bad if dividends are allowed for
In fact, after allowing for reinvested dividends (ie; looking at the ASX 200 accumulation index) the Australian share market has at least surpassed its 2007 high.
Source: Bloomberg, AMP Capital
What’s the outlook?
It’s too early to say the secular underperformance of Australian shares versus global shares has come to an end. The secular commodity bear market could have further to run and the ratio of Australian to global share prices has not yet fallen to the extreme lows that saw turning points in favour of Australian shares in 1983 and 2000. See the second chart in this note above. However, the call in favour of global shares (over and above diversification benefits) is getting a little bit weaker:
-
While Europe and Japan are continuing to ease monetary policy, the US has ended quantitative easing and is “gradually” starting to raise interest rates at a time when we continue to expect the RBA to cut interest rates further.
-
Although the $A has bounced recently and should ideally be lower, it’s still down 30% from its 2011 high, correcting much of the competitive disadvantage of Australian industry. This is evident in the resurgence in education and tourism related export earnings, and the rise in the Australian manufacturing conditions PMI to a reading of 58, well above readings for the US (50.8), Europe (51.5) and Japan (48).
-
While supply continues to rise, meaning it’s too early to say that commodity prices have bottomed, their huge declines from their 2008-2011 highs – 82% for oil, 80% for iron ore & 54% for metals – suggest that the worst may be behind us. Related to this, the risks around China may be receding as fears of a hard landing have yet again not been realised.
-
While mean reversion has not reached past extremes (as per the second chart in this note), Australian shares have already significantly underperformed global shares.
-
Finally, the risks around the Australian economy may be receding. The drag from plunging mining investment is likely to have run its course by next year, completed resource projects are resulting in surging export volumes and the rebalancing of the economy in favour of other sectors is well advanced, albeit it may yet need some more help.
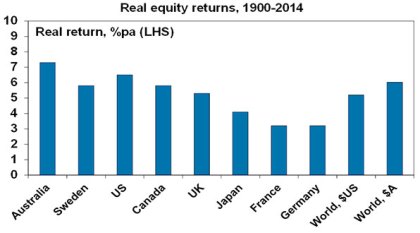
From a longer term perspective there are several supports for Australian shares. Over the period since 1900 Australian shares have had stronger real returns than most other global share markets, so they have a great track record. See the next chart.
Source: Credit Suisse Global Investment Returns Yearbook 2015, AMP Capital
Secondly, Australian shares still pay a higher dividend yield than traditional global shares: 4.8% versus 2.7%. This is important because dividend payments are a big chunk of the return an investor will get and so the higher the better.
Third, Australia’s potential growth rate is still higher than in the US, Europe and Japan thanks to higher population growth.
Finally, franking credits add around 1.5%pa to the post tax return from Australian shares for Australia-based investors.
Concluding comment
It remains too early to say that the period of underperformance of Australian shares is over, so there remains a case to have a greater exposure to global shares than at the start of last decade. However, the case against Australian shares is waning so investors should maintain a decent exposure or at least avoid moving further away from it.
Source: AMP Capital
About the Author
Dr Shane Oliver, Head of Investment Strategy and Economics and Chief Economist at AMP Capital is responsible for AMP Capital’s diversified investment funds. He also provides economic forecasts and analysis of key variables and issues affecting, or likely to affect, all asset markets.
Important note: While every care has been taken in the preparation of this article, AMP Capital Investors Limited (ABN 59 001 777 591, AFSL 232497) and AMP Capital Funds Management Limited (ABN 15 159 557 721, AFSL 426455) makes no representations or warranties as to the accuracy or completeness of any statement in it including, without limitation, any forecasts. Past performance is not a reliable indicator of future performance. This article has been prepared for the purpose of providing general information, without taking account of any particular investor’s objectives, financial situation or needs. An investor should, before making any investment decisions, consider the appropriateness of the information in this article, and seek professional advice, having regard to the investor’s objectives, financial situation and needs. This article is solely for the use of the party to whom it is provided.


